Curriculum Vitae
Full Publications
All refereed publications from the SAO/NASA ADS
Google Scholar
arXiv
Publications
(Click ADS or arXiv in each section to see full article in detail.)
Decoupled Kinematics and Excitation in the Compton-thick AGN NGC 6552:
Spatially Resolved KOOLS-IFU Observations
Oh et al. (2026b)
Hard X-ray selected Compton-thick AGNs provide a relatively obscuration-resistant census of accretion, but optical line diagnostics can be strongly shaped by extinction and geometry. Spatially resolved integral-field spectroscopy can mitigate these effects and provides direct constraints on outflow kinematics and ionization state on kiloparsec scales. We present KOOLS-IFU optical integral-field spectroscopy of NGC 6552 obtained on the 3.8 m Seimei Telescope. Using spatially resolved emission-line ratios and non-parametric [O III]λ5007 kinematics over the central ∼2 kpc, we test whether ionized-gas kinematics are locally coupled to excitation. The [O III]λ5007 width W80 is broadly elevated across the inner region (∼530–830 km s−1) and declines monotonically with projected galactocentric distance, consistent with a centrally concentrated outflow that decelerates at larger radii. Despite this clear kinematic structure, neither W80 nor the velocity asymmetry parameter ∆v shows a statistically significant correlation with [O III]λ5007/Hβ. Order-of-magnitude outflow energetics yield ĖK/Lbol ≈ 0.01%–0.28% (for assumed ne = 50–1000 cm−3), consistent with [O III]-based estimates tracing only the ionized phase of a multi-phase outflow. We conclude that in NGC 6552 both the total line broadening traced by W80 and ∆v are consistent with being governed primarily by spatial dynamical structure and line-of-sight superposition of multiple kinematic components, with no statistically significant coupling to excitation-driven processes detected at our sensitivity level. A positive W80–[O III]λ5007/Hβ coupling does emerge in the small subset of bins for which the two-component fit is most strongly favored statistically, which deeper observations will be needed to confirm.
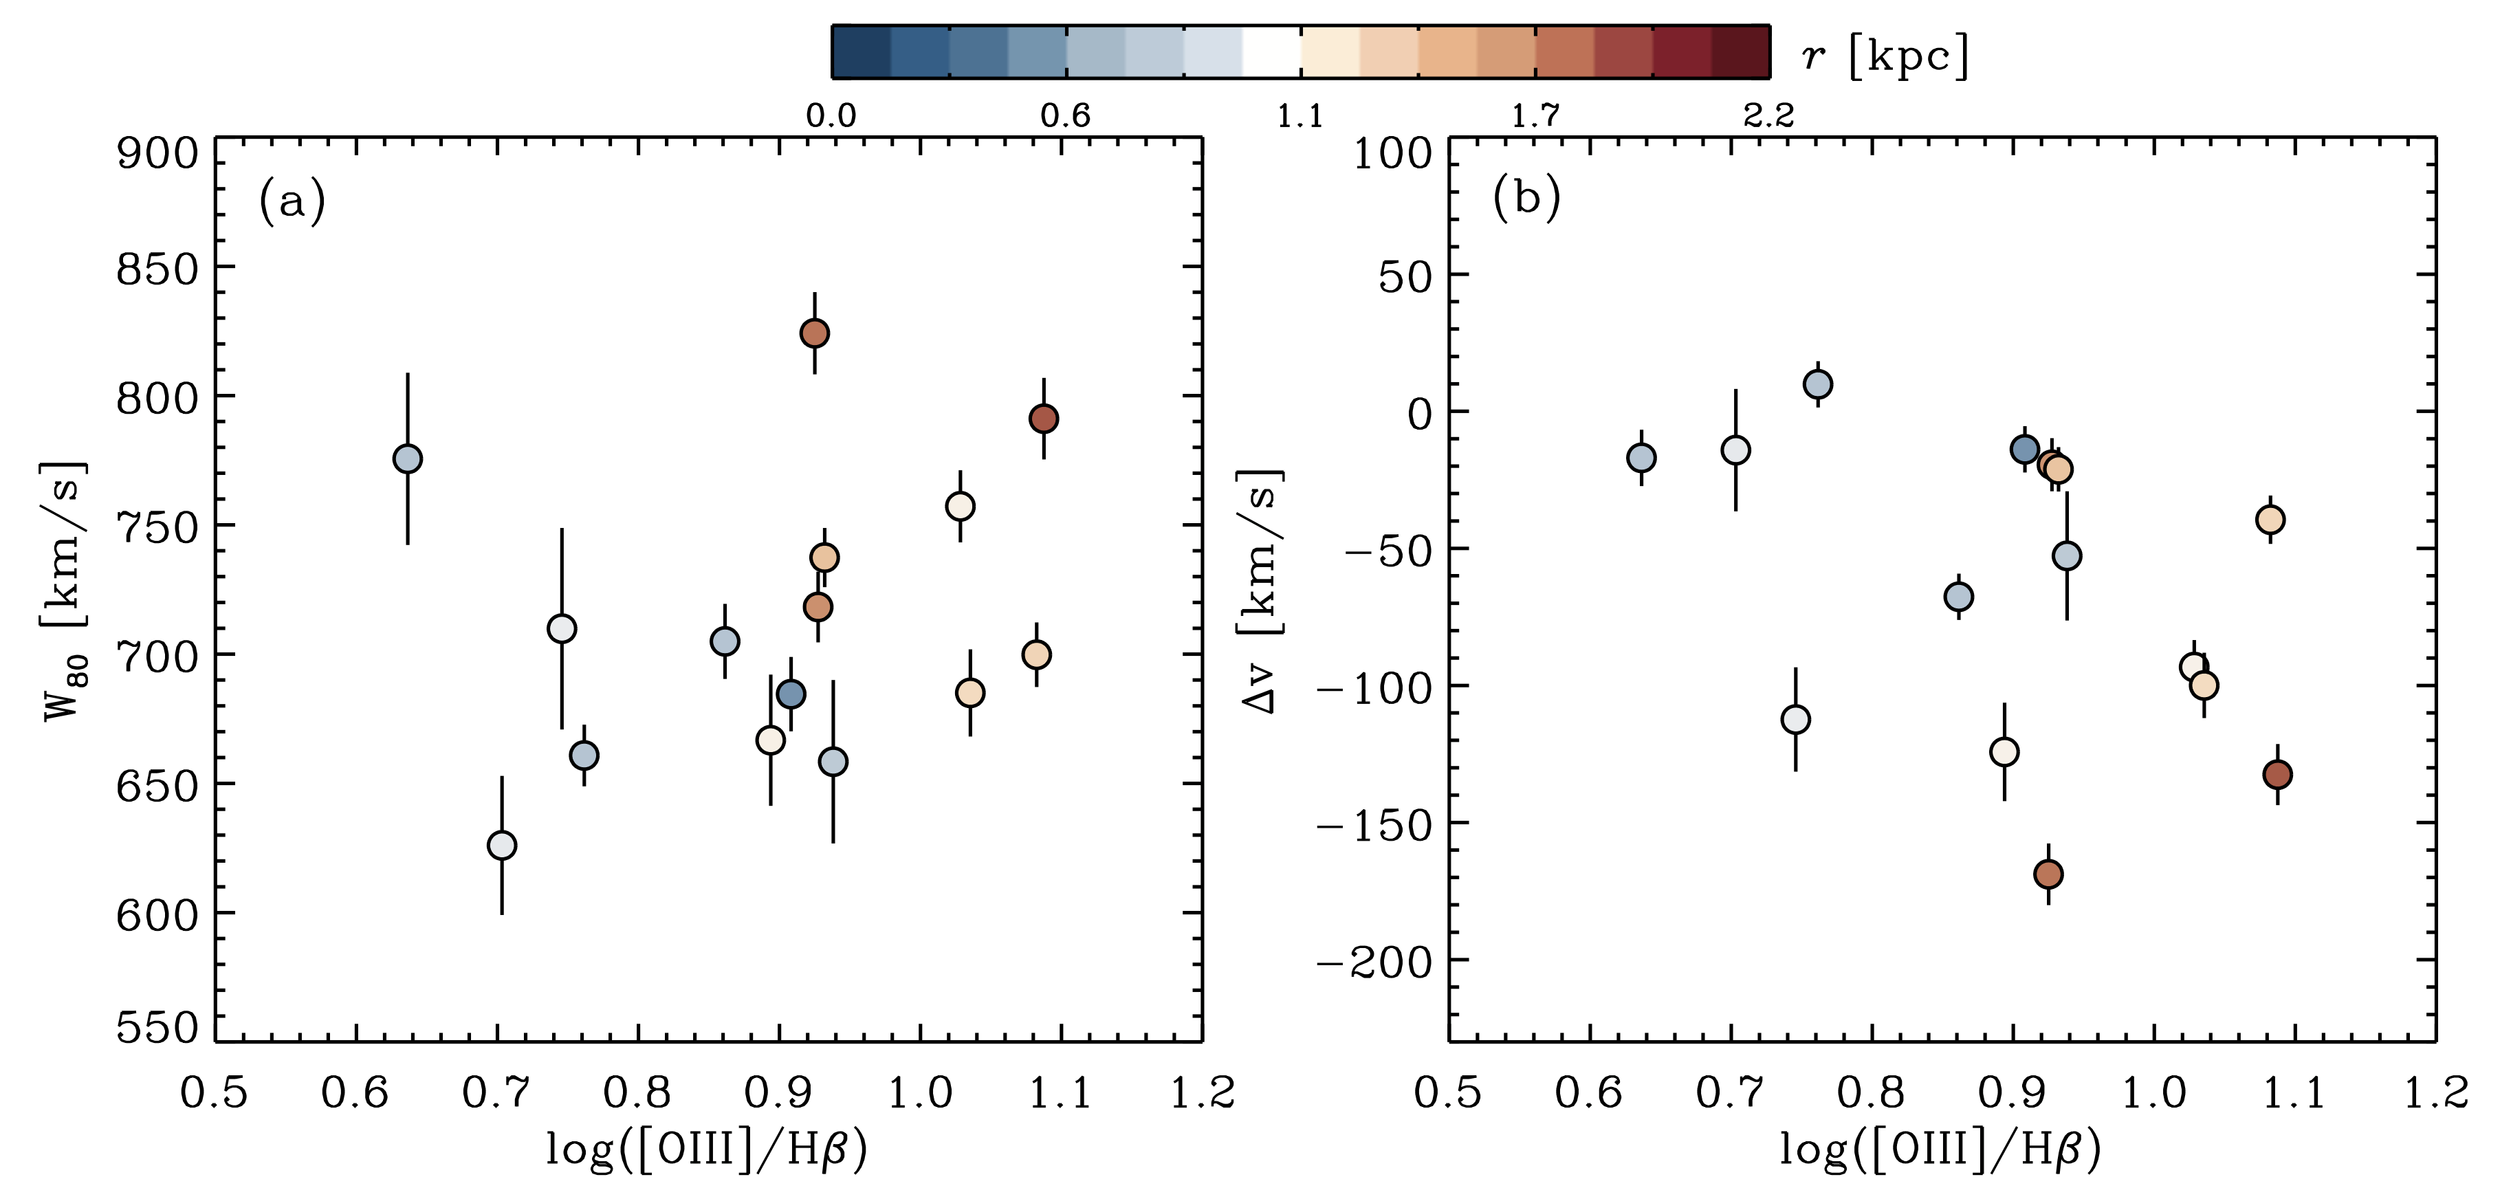
(a) W80 and (b) velocity asymmetry ∆v of [O III]λ5007 as a function of log([O III]/Hβ) for the Nbins = 15 bins with A/N > 3 in both lines, color-coded by projected galactocentric distance r. Vertical error bars are Monte Carlo uncertainties. Neither W80 (Spearman ρ = +0.24, p = 0.41) nor ∆v (Spearman ρ = −0.40, p = 0.14) shows a significant correlation with log([O III]/Hβ). In panel (a), W80 depends significantly on r (Spearman ρ = −0.54, p = 0.039) but not on the excitation ratio.

Spatially resolved EWHα and ionizing-photon budget diagnostics. Top-left: EW Hα map. The three map panels show per-spaxel logτ≡log(QpAGB/Qreq) for low, fiducial, and high pAGB normalizations (qpAGB=10^40.0, 10^40.5, 10^41.0 photons s−1 M⊙−1). Black contours trace the continuum proxy fcont≡F(Hα)/EWHα used to assign M⋆(i) (Section 2.5). Top-right: cumulative ratio log[QAGN/Qreq(<r)], shaded over the logQAGN range of Section 2.4. Bottom-right: radial logτ profile (annular medians, fiducial 16th–84th percentile band); the dotted line at logτ=0 marks τ=1.
We present evidence that the Hector Galaxy Survey galaxy C901005481609968 (z_cl = 0.0553), which exhibits spatially extended LINER-like emission in optical integral-field spectroscopy (IFS), hosts a low-luminosity active galactic nucleus (LLAGN) that contributes substantially to its ionization budget. Although the galaxy is not selected as an AGN by mid-infrared AGN color criteria, archival Chandra data reveal a compact nuclear X-ray source with log L_X ≈ 41.46 erg s^-1, supporting the presence of an LLAGN. Spatially resolved emission-line diagnostics show LINER-like line ratios across most spaxels with S/N ≥ 3, while spatially resolved τ maps (τ ≡ Q_pAGB/Q_req) indicate a widespread photon deficit (log τ < 0 over most of the mapped region). Even under the most optimistic pAGB normalizations, the nuclear region remains at τ < 1. Line-ratio-kinematic tests find no evidence for shock-dominated excitation as the primary driver of the extended emission, although a localized or sub-dominant shock contribution cannot be ruled out with the present data. We use this galaxy as a pilot case because the combination of Hector IFS and an independent nuclear X-ray constraint provides a stringent validation of the spatially resolved photon-budget framework. Our results indicate that evolved stellar populations alone cannot account for the observed emission, that an additional nuclear ionizing source is required at least in the inner region, and that a weak LLAGN likely contributes to the ionizing budget, particularly in the inner region. Our results demonstrate that extended LINER-like emission can conceal a substantial LLAGN contribution even when traditional optical and infrared AGN indicators are weak, and that spatially resolved photon-budget tests combined with X-ray constraints can effectively reveal such hidden activity.
Capturing Star Formation Activity from Compressed Photometric Images of Galaxies
Oh and Turp (2025b)
We present a novel approach for classifying star-forming galaxies using photometric images. By utilizing approximately 124,000 optical color composite images and spectroscopic data of nearby galaxies at 0.01<z<0.06 from the Sloan Digital Sky Survey, along with follow-up spectroscopic line measurements from the OSSY catalog, and leveraging the Vision Transformer machine-learning technique, we demonstrate that galaxy images in JPEG format alone can be directly used to determine whether star-forming activity dominates the galaxy, bypassing traditional spectroscopic analyses such as emission-line diagnostic diagrams. We anticipate that this method holds significant potential for application in current and future large-scale surveys, such as Euclid, the Dark Energy Survey (DES), and the Legacy Survey of Space and Time (LSST).

Flowchart illustrating a general overview of this work. The Vision Transformer (ViT), shown in the middle with orange diamonds, is fed SDSS gri color composite JPEG images and used to predict emission line ratios.
AGN Outflows and their Properties in Mrk 766
Oh et al. (2025a)
ADS / Open access / arXiv
We present the emission-line flux distributions and their ratios, as well as the gas outflow features, of the innermost 2 kpc region of the type 1 Seyfert galaxy Mrk 766, using the Kyoto Okayama Optical Low-dispersion Spectrograph with an optical-fiber integral field unit on the Seimei Telescope. We find that the central region of Mrk 766 is kinematically disturbed, exhibiting asymmetric and radially distributed AGN-driven ionized gas outflows traced by \OIII\ with velocities exceeding 500 km/s. The mass of the ionized gas outflow is estimated to be 10^(4.65−5.95)M⊙, and the mass outflow rate is 0.14−2.73 M⊙ yr^−1. This corresponds to a kinetic power, E’_K, of 4.31×10^40 erg s^−1<E’_K<8.62×10^41 erg s^−1, which is equivalent to 0.08%−1.53% of the bolometric luminosity, Lbol. This result is consistent with other observed properties of ionized gas outflows, although it is lower than the theoretical predictions in AGN feedback models (∼5%), implying that ionized gas outflows traced by \OIII\ represent only a minor fraction of the total outflows ejected from the host galaxy. Given the asymmetric and radially distributed outflow signatures observed across the host galaxy within the limited field of view, the maximum distance the outflowing gas has traveled remains an open question.

AGN-driven outflow gas components detected within the KOOLS-IFU arrays across the host galaxy. The vertical dark gray lines in the panels indicating velocity denote v05, v10, v50, v90, and v95. Color-filled hexagons and the corresponding dashed lines, overlaid on the SDSS gri composite image, illustrate the locations from which the spectrum is extracted. In the case of low Gaussian amplitude over noise ratio (<3) in emission lines, red labels are used.
ApJS Special Issue: BASS DR2
Collection of our recent research papers from the BASS DR2, an all-sky survey of the brightest and most powerful nearby hard-X-ray-selected AGN is published (2022).
(Click the figure below to see more about the ApJS special issue)
BASS XXIV: The BASS DR2 Spectroscopic Line Measurements and AGN Demographics
Oh et al. (2022)
We present the second catalog and data release of optical spectral line measurements and AGN demographics of the BAT AGN Spectroscopic Survey, which focuses on the Swift-BAT hard X-ray detected AGNs. We use spectra from dedicated campaigns and publicly available archives to investigate spectral properties of most of the AGNs listed in the 70-month Swift-BAT all-sky catalog; specifically, 743 of the 746 unbeamed and unlensed AGNs (99.6%). We find a good correspondence between the optical emission line widths and the hydrogen column density distributions using the X-ray spectra, with a clear dichotomy of AGN types for NH = 10^22 cm−2. Based on optical emission-line diagnostics, we show that 48%–75% of BAT AGNs are classified as Seyfert, depending on the choice of emission lines used in the diagnostics. The fraction of objects with upper limits on line emission varies from 6% to 20%. Roughly 4% of the BAT AGNs have lines too weak to be placed on the most commonly used diagnostic diagram, [OIII]λ5007/Hβ versus [NII]λ6584/Hα, despite the high signal-to-noise ratio (S/N) of their spectra. This value increases to 35% in the [OIII]λ5007/[OII]λ3727 diagram, owing to difficulties in line detection. Compared to optically-selected narrow-line AGNs in the Sloan Digital Sky Survey, the BAT narrow-line AGNs have a higher rate of reddening/extinction, with Hα/Hβ > 5 (∼ 36%), indicating that hard X-ray selection more effectively detects obscured AGNs from the underlying AGN population. Finally, we present a subpopulation of AGNs that feature complex broad-lines (34%, 250/743) or double-peaked narrow emission lines (2%, 17/743).
Example of spectral line fitting. Counterpart name, BAT name, redshift, instrument, observed date, and exposure time are shown at the top. Top left: Digitized Sky Survey image in the arcmin scale. Top right: The black line represents the observed spectrum in the rest frame. The red dashed-dotted line is the best fit. BPT diagnostics diagrams are shown in the insets. Middle and bottom rows show the spectral fitting result in detail, and they include the labels of the detected emission-lines. In the case of low A/N, smaller than 3, red labels are used. The blue and green Gaussians are narrow and broad emission-line components, respectively. Residuals are shown in black dots.
Correlation between black hole mass (MBH) and stellar velocity dispersion (σ∗) of galaxies.
We present the discovery of rare active galactic nuclei (AGNs) in nearby (z < 0.05) compact elliptical galaxies (cEs) located in isolated environments. Using spectroscopic data from the Sloan Digital Sky Survey (SDSS) Data Release 12, four AGNs were identified based on the optical emission-line diagnostic diagram. SDSS optical spectra of AGNs show the presence of distinct narrow-line emissions. Utilizing the black hole (BH) mass-stellar velocity dispersion scaling relation and the correlation between the narrow L([OIII])/L(Hβ) line ratio and the width of the broad Hα emission line, we estimated the BH masses of the cEs to be in the range of 7 x 10^5 - 8 x 10^7 Msun. The observed surface brightness profiles of the cEs were fitted with a double Sersic function using the Dark Energy Camera Legacy Survey r-band imaging data. Assuming the inner component as the bulge, the K-band bulge luminosity was also estimated from the corresponding Two Micron All Sky Survey images. We found that our cEs follow the observed BH mass-stellar velocity dispersion and BH mass-bulge luminosity scaling relations, albeit there was a large uncertainty in the derived BH mass of one cE. In view of the observational properties of BHs and those of the stellar populations of cEs, we discuss the proposition that cEs in isolated environments are bona fide low-mass early-type galaxies (i.e., a nature origin).
The black line represents the observed spectrum. The blue and green Gaussians are narrow and broad emission-line components, respectively. The red dashed–dotted line is the best fit. Residuals are shown with black dots.
We present an observed relationship between the Eddington ratio (λEdd) and the optical narrow-emission-line ratio([NII]λ6583/Hα) of X-ray-selected broad-line active galactic nuclei (AGNs) at 0.6<z<1.7. We use 27 near-infrared spectra from the Fiber Multi-Object Spectrograph along with 26 sources from the literature. We show that the λEdd and [NII]λ6583/Hα ratio at 0.6<z<1.7 exhibits a similar anti-correlation distribution of λEdd−[NII]λ6583/Hα, as has been found for local (<z> = 0.036), ultra-hard, X-ray-selected AGNs. The observed distribution implies that there is a consistent relationship from local to z∼1.7, which corresponds from the present time to 4 Gyr old. Further study of high-redshift, low-Eddington-ratio AGNs (log λEdd < −2) is necessary to determine fully whether the λEdd−[NII]λ6583/Hα anti-correlation still holds in high-redshift AGNs at low Eddington ratios.
All-sky map of the Swift-BAT 105 month sources. Click to see the whole features.
The Swift-BAT 105 month all-sky hard X-ray survey
Oh et al. (2018)
The 105 month Swift-BAT survey is a uniform hard X-ray all-sky survey with a sensitivity of 8.40×10 −12 ergs −1 cm −2 over 90% of the sky and 7.24 × 10 −12 erg s −1 cm −2 over 50% of the sky in the 14 − 195 keV band. The Swift -BAT 105 month catalog provides 1633 (423 new detections) hard X-ray sources in the 14 − 195 keV band above the 4.8σ significance level. Adding to the previously known hard X-ray sources, 32% (137/423) of the new detections are identified as Seyfert AGN in nearby galaxies (z < 0.2). The majority of the remaining identified sources are X-ray binaries (7%, 29) and blazars/BL Lac objects (9%, 36). As part of this new edition of the Swift-BAT catalog, we release eight-channel spectra and monthly sampled light curves for each object in the online journal and at the Swift -BAT 105 month Web site.
The observed relationship between MBH, Lbol, and λEdd with optical emission line ratios
Oh et al. (2017)
Using nearby and bright hard X-ray selected AGN, I showed that [NII]λ6583/Hα ratio exhibits a significant correlation with λ Edd(RPear=-0.44, p-value=3x10-13, σ=0.28 dex), and correlation is not solely driven by MBH or Lbol.
The observed correlation between [NII]λ6583/Hα ratio and MBH is stronger than the correlation with L bol, but both are weaker than the λEdd correlation. This implies that the larg-scale narrow lines of AGN host galaxies carry information about the accretion state of the AGN central engine. We propose that the [NII]λ6583/Hα is a useful indicator of Eddington ratio with 0.6 dex of rms scatter, and that it can be used to measure λEdd and thus MBH from the measured Lbol, even for high redshift obscured AGN. Possible physical mechanisms behind this correlation are 1) mass-metallicity relation, 2) X-ray heating, and 3) radiatively driven outflows.
BPT diagnostic diagram as a function of Eddington ratio for hard X-ray selected AGN (BASS). Click to see the whole features.
Black hole mass and bolometric luminosity distribution for type 1 AGN as a function of type 1 AGN fraction (color), Click to see the whole features.
A New Catalog of Type 1 AGNs and its Implications on the AGN Unified Model
Oh et al. (2015)
I discovered a substantial number of unidentified and unexplored population of galaxies featuring weak broad-line region in the nearby Universe (z < 0.2) and investigated their implications on the AGN unified model. Through this research, I proved that the receding torus model is only partially valid and it requires more valid formulation to explain the current observational results. Furthermore, I showed that neither black hole mass nor bolometric luminosity solely determines the type 1 AGN fraction which is a measure of an average torus opening angle.
Demographics of Sloan Digital Sky Survey galaxies along the Hubble Sequence
Oh et al. (2013)
I presented the statistical properties of a volume-limited sample of 7429 nearby (z = 0.033–0.044) galaxies from the Sloan Digital Sky Survey Data Release 7. Our database includes morphology distribution as well as the structural and spectroscopic properties of each morphology type based on the spectral line strengths (the OSSY catalog, Oh et al. 2011). Our database does not include galaxies that are apparently smaller and flatter because morphology classification of them turned out to be difficult. Our statistics confirmed the up-to-date knowledge of galaxy populations, e.g., correlations between morphology and line strengths as well as the derived ages.
Samples of the SDSS DR7 composite images of morphologically classified galaxies in the Hubble Sequence. Click to see the whole features.
Example of spectral line decomposition. Click to see the whole features.
Spectroscopic data provides a fossil record of galaxies featuring stellar absorption and nebular emission lines. The prominent stellar absorption features give us the average surface gravities, effective temperatures, metal abundances, and kinematics of stellar components. Nebular emission lines, on the other hand, probe the physical state of the ionized gas in galaxies and thus can be used to trace the nuclear activity of central supermassive black holes, or their instantaneous star formation rate. From the detailed and improved analysis of more than half million SDSS galaxy spectra (z < 0.2, N=664,187), I released a publicly available galaxy line strength database (the OSSY database) to the community which provides the strength of nebular emission lines, stellar absorption lines, and stellar velocity dispersion. The OSSY database provides more accurate line strengths by decomposing nebular emission lines from stellar absorption features. The OSSY database also achieved better spectral line fitting by adopting empirical stellar templates compared to the SDSS pipeline. Moreover, the database provides a quality parameter assessing the goodness of spectral line fitting so that users can chose proper datasets based on their purposes.
“(The OSSY database is available from this link: https://data.kasi.re.kr/vo/OSSY/)”
Talks
Conference presentations
Korean Astronomical Society Meeting, Jeju, Korea (Oct. 2025)
Korean Astronomical Society Meeting, Busan, Korea (Apr. 2022)
BAT AGN Spectroscopic Survey team meeting, (virtual, July 2020)
Korean Astronomical Society Meeting, Busan, Korea (Apr. 2019)
BAT AGN Spectroscopic Survey team meeting, University of Florida, Gainesville, USA (Feb. 2019)
East Asia AGN Workshop 2019, Institute of Astronomy and Astrophysics, Academia Sinica, Taiwan (Jan. 2019)
Formation and evolution of SMBHs revealed by 'Wide field', 'Multi-wavelength', and 'Transient' surveys with HSC, Tohoku University, Japan (Nov. 2018)
Korean Astronomical Society Meeting, Cheongsong, Korea (Oct. 2018)
Korean Astronomical Society Meeting, Hongcheon, Korea (May 2018)
KOOLS-IFU workshop, Kyoto University, Japan (Feb. 2018)
American Astronomical Society 231st Meeting, Washington DC, USA (Jan. 2018): Special Session
Korean Astronomical Society Meeting, Daejeon, Korea (Oct. 2016)
East Asia AGN Workshop 2016, Seoul National University, South Korea (Sep. 2016)
The X-ray View of Black Hole Activity in the local Universe, ETH Zurich, Switzerland (Feb. 2016)
Demographics and environments of AGN from multi-wavelength surveys, Crete, Greece (Sep. 2015)
International Astronomical Union 284 Symposium, Preston, UK (Sep. 2011)
American Astronomical Society 215th Meeting, Washington DC, USA (Jan. 2010)
The 2nd Korea-Japan Science Seminar, Hiraizumi, Japan (Nov. 200)
Korean Astronomical Society Meeting, Gwacheon, Korea (Apr. 2009)
Departmental seminars
Department of Astronomy and Space Science, Chungnam National University, South Korea (Jan. 2017)
Department of Astronomy, Kyoto University, Japan (Oct. 2016)
National Astronomical Observatory of Japan (Mitaka) (Oct. 2016)
Kavli Institute for the Physics and Mathematics of the Universe, Japan (Oct. 2016)
Instituto de Astrofisica, Pontificia Universidad Cato ́lica de Chile, Chile(Mar. 2016)
Physics and Astronomy department, Seoul National University, Korea (Aug. 2015)
Korea Astronomy and Space Science Institute, South Korea (July 2015)
Department of Astronomy, University of Maryland, USA (May 2015)
Astrophysics division (code 600), NASA Goddard Space Flight Center, USA (May 2015)
Institute for Astronomy, Department of Physics, ETH Zurich, Switzerland (Apr. 2014)
Institute for Astronomy, Department of Physics, ETH Zurich, Switzerland (Oct. 2013)
School of Physics and Astronomy, The University of Nottingham, UK (Jan. 2012)
Awards
USD 410k (PI): Outstanding Mid-Career Research Grant Program, National Research Foundation of Korea (Mar., 2025)
USD 305k (PI): Young Researcher Program, National Research Foundation of Korea (Mar., 2020)
USD 640k (co-I): NASA Astrophysical Data Analysis Program (NNH18ZDA001N) (Sep., 2019)
USD 5.5k (PI): The CSR travel grant, Swiss Society for Astrophysics and Astronomy (July, 2017)
USD 5.5k (PI): MERAC funding and travel grant, Swiss Society for Astrophysics and Astronomy (Feb., 2016)
Outstanding paper award (the best thesis), Graduate School of Yonsei University (Oct., 2015)
USD 23k (PI): Swiss Government Excellence Scholarship (2013 - 2014)
Outstanding paper award (journal), Graduate School of Yonsei University (Oct., 2011)
USD 30k (PI): Lotte Scholarship, The Lotte Scholarship Foundation (2006 - 2007, 2010)
The Highest Honors, Yonsei University (May, 2007)
High Honors, Yonsei University (Oct., 2006)
Honors, Yonsei University (May, 2006)
Yonsei designated scholarship (Mar., 2003)
Accepted Telescope Time Proposals
(coI) ESO VLT 8.2m, period 116, XSHOOTER at Paranal, Chile: 22.3 hours (2025)
(coI) ESO VLT 8.2m, period 115, XSHOOTER at Paranal, Chile: 21.1 hours (2024)
(coI) ESO VLT 8.2m, period 112, XSHOOTER at Paranal, Chile: 32 hours (2023)
(coI) ESO VLT 8.2m, period 110, XSHOOTER at Paranal, Chile: 18.8 hours (2022)
(coI) ESO VLT 8.2m, period 109, XSHOOTER at Paranal, Chile: 30.7 hours (2022)
(delegated PI) ESO VLT 8.2m, period 108, XSHOOTER at Paranal, Chile: 36.1 hours (2021)
(delegated PI) ESO VLT 8.2m, period 106, XSHOOTER at Paranal, Chile: 39 hours (2020)
(delegated PI) ESO VLT 8.2m, period 105, XSHOOTER at Paranal, Chile: 40.75 hours (2019)
(delegated PI) ESO VLT 8.2m, period 104, XSHOOTER at Paranal, Chile: 55 hours (2019)
(delegated PI) ESO VLT 8.2m, period 103, XSHOOTER at Paranal, Chile: 62 hours (2019)
(delegated PI) ESO VLT 8.2m, period 102, XSHOOTER at Paranal, Chile: 61 hours (2018)
(coI) SOAR 4.1m, GOODMAN at CTIO, Chile: 8 nights (2018)
(delegated PI) ESO VLT 8.2m, period 101, XSHOOTER at Paranal, Chile: 29 hours (2018)
(coI) Magellan Clay 6.5m, LDSS3 at Las Campanas, Chile: 2 night (2018)
(PI) ESO VLT 8.2m, period 100, XSHOOTER at Paranal, Chile: 1 hour (2017)
(PI) ESO VLT 8.2m, period 99, FORS2 at Paranal, Chile: 31 hours (2017)
(PI) ESO VLT 8.2m, period 99, XSHOOTER at Paranal, Chile: 37 hours (2017)
(PI) ESO VLT 8.2m, period 98, XSHOOTER at Paranal, Chile: 13 hours (2016)
(coI) Magellan Clay 6.5m, LDSS3 at Las Campanas, Chile: 1 night (2016)
(coI) Ir ́en ́ee du Pont 2.5m, B&C at Las Campanas, Chile: 10 nights (2016)
(coI) Wisconsin-Indiana-Yale-NOAO (WIYN) 3.5m, MiniMo at Kitt-Peak, USA: 5 nights (2011 - 2012)